With the recent flooding across Brisbane, we have received an influx of enquiries relating to flooding. It seems there is a lot of confusion amongst the general public in relation to Brisbane City Council’s flood planning levels and how they relate to the recent events. Many affected residents are exploring ways to minimise future impacts from flooding on their property.
Flood planning levels
City Plan 2014 predominantly regulates development in flood prone areas in relation to the flood planning levels which can be determined from a FloodWise Property Report. These levels are typically expressed as a percentage—the annual exceedance probability (AEP). The percentage represents the chance that flooding could exceed a particular level in any given year. For example, if the 1% AEP level is 5.6m AHD, there is a 1% chance in any year that flooding will exceed that level. For the most part, City Plan 2014 does not account for flood events beyond the 1% AEP level.
While these percentages are often translated in general use as a ‘1 in 100 year flood event’ (1% AEP), ‘1 in 50 year flood event’ (2% AEP) and so on, it is wrong to deduce that a 1% AEP event will only occur once per century, or a 2% AEP event will only occur every 50 years. Rather, the probability of these events occurring is the same every year. The mere 11-year separation between major flooding in 2011 and 2022 is evidence of that.
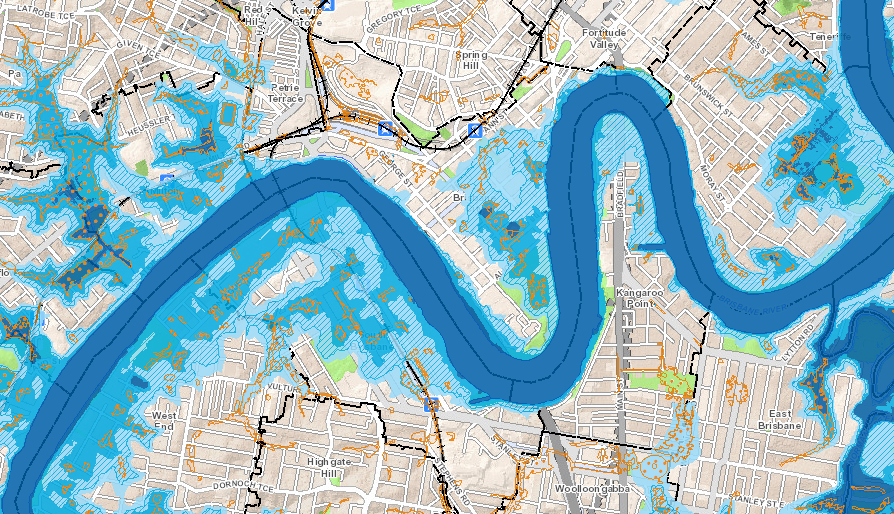
Flood mapping
Brisbane City Council provides a visual representation of its flood modelling in the Flood Awareness Map. This mapping shows flood events up to the 0.05% AEP level. The flood planning levels (i.e. up to 1% AEP) are also reflected in the City Plan 2014 Flood overlay (see City Plan 2014 mapping).
It is important to remember that in theory there is no ‘maximum’ level of flooding and a property being unaffected by Council’s modelling does not necessarily mean that it is completely immune. There are many examples of properties unaffected even by the 0.05% AEP flood model that experienced considerable flooding in this event.
Sources of flooding
The source of flooding in Brisbane can generally be placed into one of four categories, each with distinct characteristics:
| Brisbane River | Flooding can be controlled to a degree by Somerset and Wivenhoe dams which have flood storage capability. Floodwater may continue to rise after rainfall as dam releases occur and water makes its way downstream. |
| Creek/waterway | May see more rapid rises and falls than river flooding and is generally less predictable. Characteristics (e.g. rate and severity of flooding and velocity of floodwater) can vary between creeks and localities. |
| Overland flow | Commonly referred to as ‘flash flooding’. Overland flow affects dry creeks, natural gullies and other areas where heavy rainfall will concentrate stormwater on its path to a creek or waterway. It is not uncommon for overland flow paths to affect private properties and roads (including elevated suburbs). |
| Storm tide | Low lying areas (close to sea level) may be subject to temporary flooding in storm tide events (e.g. king tides) and/or permanent inundation with long-term sea level rises. |
The recent event involved a combination of Brisbane River, creek/waterway, and overland flow flooding. The severity of flooding varied across the city based on local rainfall intensity. The 2022 flooding resulted in significant overland flow and creek/waterway flooding that was relatively unseen in 2011.
Reducing flood impacts
Since this flood, we have seen an increase in enquiries from residents and business owners looking to improve the flood immunity of their property. The most common solutions being explored are earthworks (filling and/or cutting) and building works (raising structures)—both aiming to bring floor and/or ground levels above the flood level just experienced.
Earthworks
Cutting, filling, and retaining in a flood-affected area may constitute assessable development under City Plan 2014, requiring a development permit from Council.
It should be noted that filling in an overland flow path is generally not supported by Council. In all cases, earthworks must not result in concentration of stormwater or increased flooding in neighbouring properties. Council may also be concerned about flood storage in certain catchments—particularly creeks and waterways (i.e. where filling contributes to higher overall flood levels due to reduction of the flood plain).
If you are considering earthworks, this should be discussed with a civil engineer. They can assist with design and certification and any development permits for operational works that may be required.
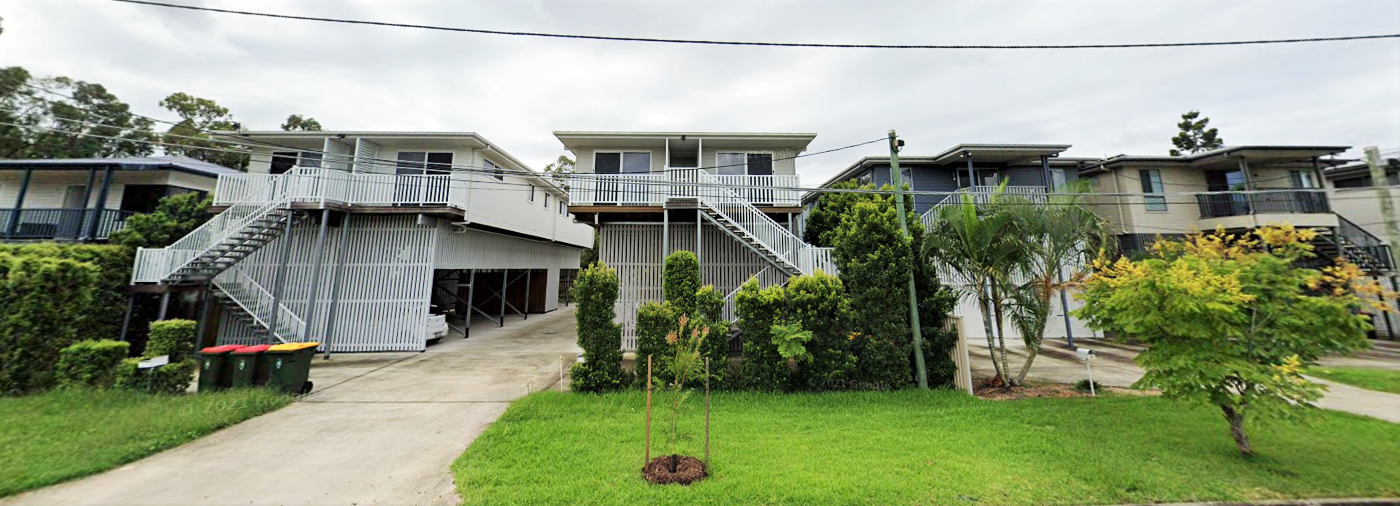
Raising structures
Raising an existing dwelling house (single dwelling on a lot) can often be done without development approval from Council if it does not exceed the maximum building height (in most instances, 9.5m above natural ground level) and the resulting floor levels meet the minimum requirements under the Flood overlay code. Other planning scheme overlays and neighbourhood plans may vary these provisions for particular sites.
| Note—Following the 2011 floods, Brisbane City Council temporarily permitted houses affected by the floods to be raised to up to 11.5m without triggering a development application. It is not currently known whether any similar Temporary Local Planning Instruments (TLPIs) are proposed after the recent flood event. |
For commercial or other residential properties, raising structures will likely require development approval or a change application to amend an existing approval.
We can check the requirements for raising your house or other structures and assist with a development application if required—just get in touch.
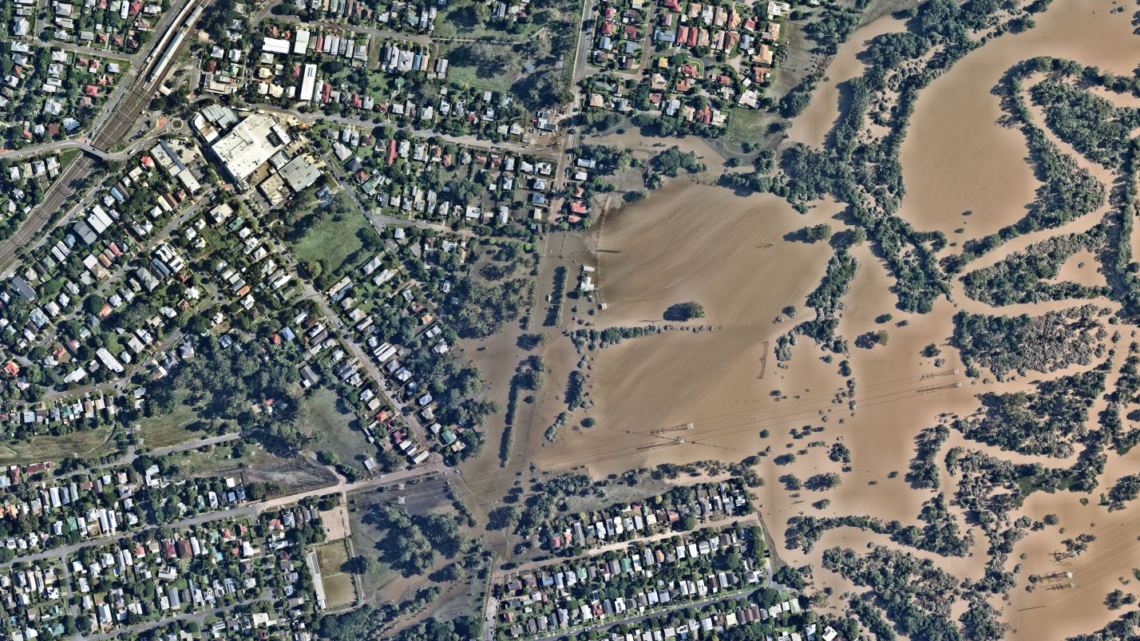
*Featured image: Nearmap aerial photography on Wednesday, 2 March 2022 showing Oxley Creek (Oxley and Rocklea) after the flood peak.


